
Welcome to ABCindex, a tool to quantify and visualize the in vitro effects of drug combinations. The Anti-Biofilm Combination Index (ABCI) is a metric designed to assess drug combination therapy in checkerboard assays, without relying on activity thresholds (e.g. MIC, MBIC, or MBEC), which present significant challenges when evaluating antibiofilm activity.
Here you can calculate ABCIs for your checkerboard data and visualize the results in different plots designed to quickly identify promising interactions and favourable drug ratios.
Click the Get Started button to upload your data. To learn more about how ABCI is calculated, or how to use ABCindex, check the Help pages below. For more information, including how to cite ABCindex, please refer to the About page.
Help for ABCindex
The first section covers how to use the app, while the second section details the calculation of ABCI values.
Table of contents
How to use ABCindex
Interpretation and visualization of checkerboard assays.
1. Prepare your data
ABCindex takes any form of checkerboard assay data (e.g. crystal violet or TTC) in the same format produced by microplate readers. Data can be provided as direct measurements (absorbance, fluorescence) or relative measurements (percentage of untreated or relative to an external control). ABCI was designed for antibiofilm activity data but can be used for any kind of checkerboard assays, including planktonic experiments (see the ABCI calculations tutorial for more information).
We provide input templates in .xslx or .ods format. The only necessary preprocessing step is blank subtraction: if it has not been performed by the microplate reader software, please subtract the blank before uploading your data.
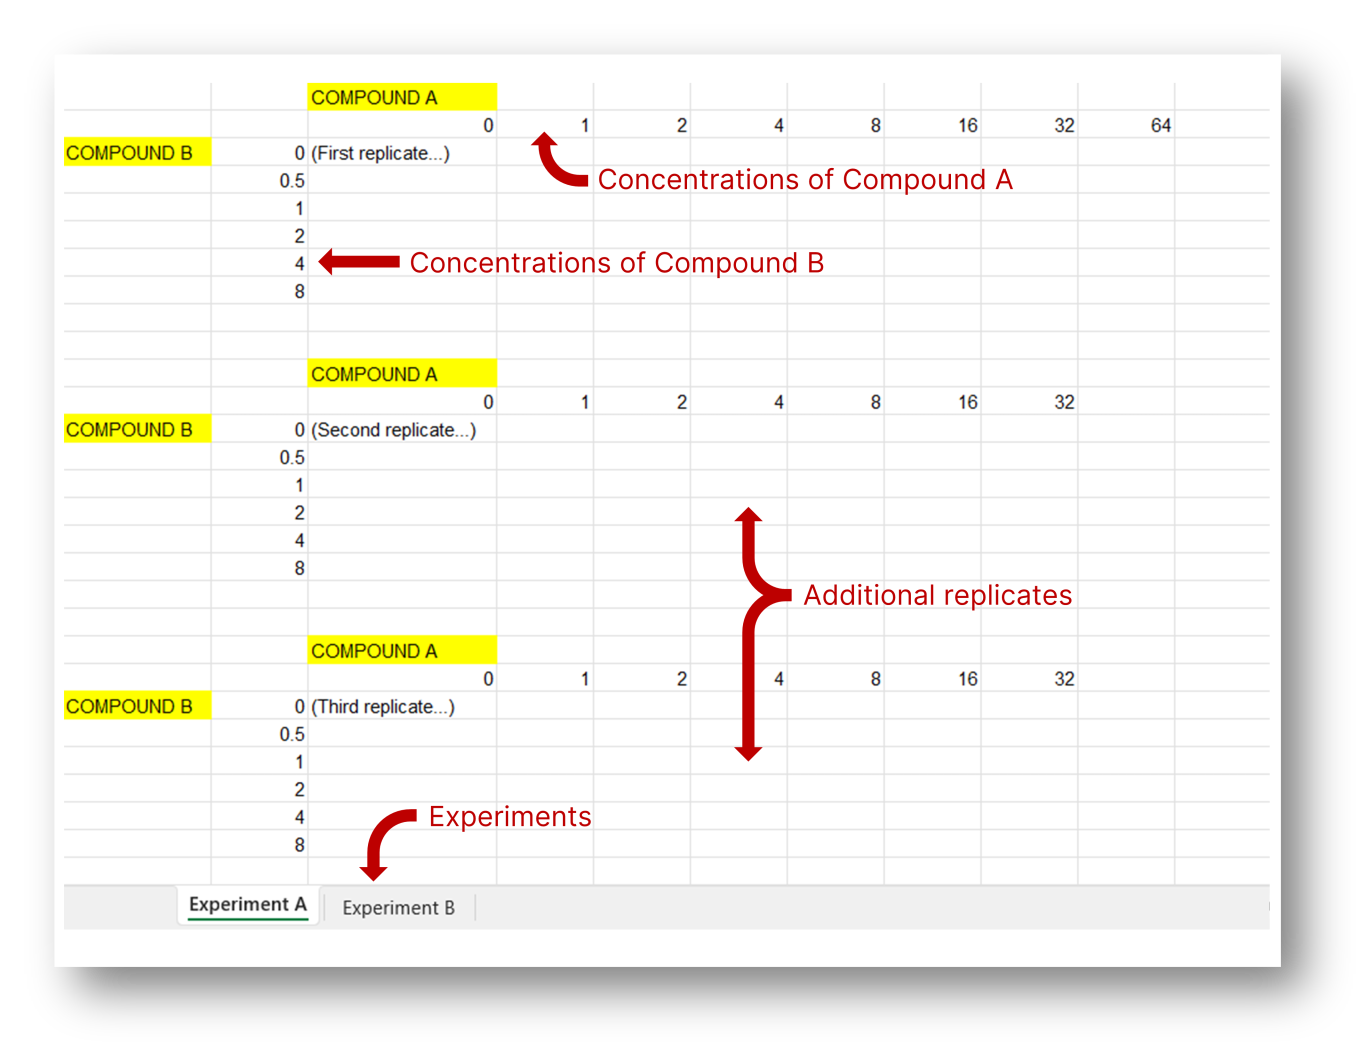
You can upload different experiments as sheets in the input file; they will become different panels in the final graph. Each experiment can have any number of replicates, which must be provided as individual tables within the same sheet separated by at least one blank row. Not all treatment concentrations need to be represented in every replicate.
Data must include untreated wells (concentration = 0). Do not include in the input any wells that are not intended to be plotted in the final graph (e.g. blank wells or external controls).
2. Upload and analyze your data
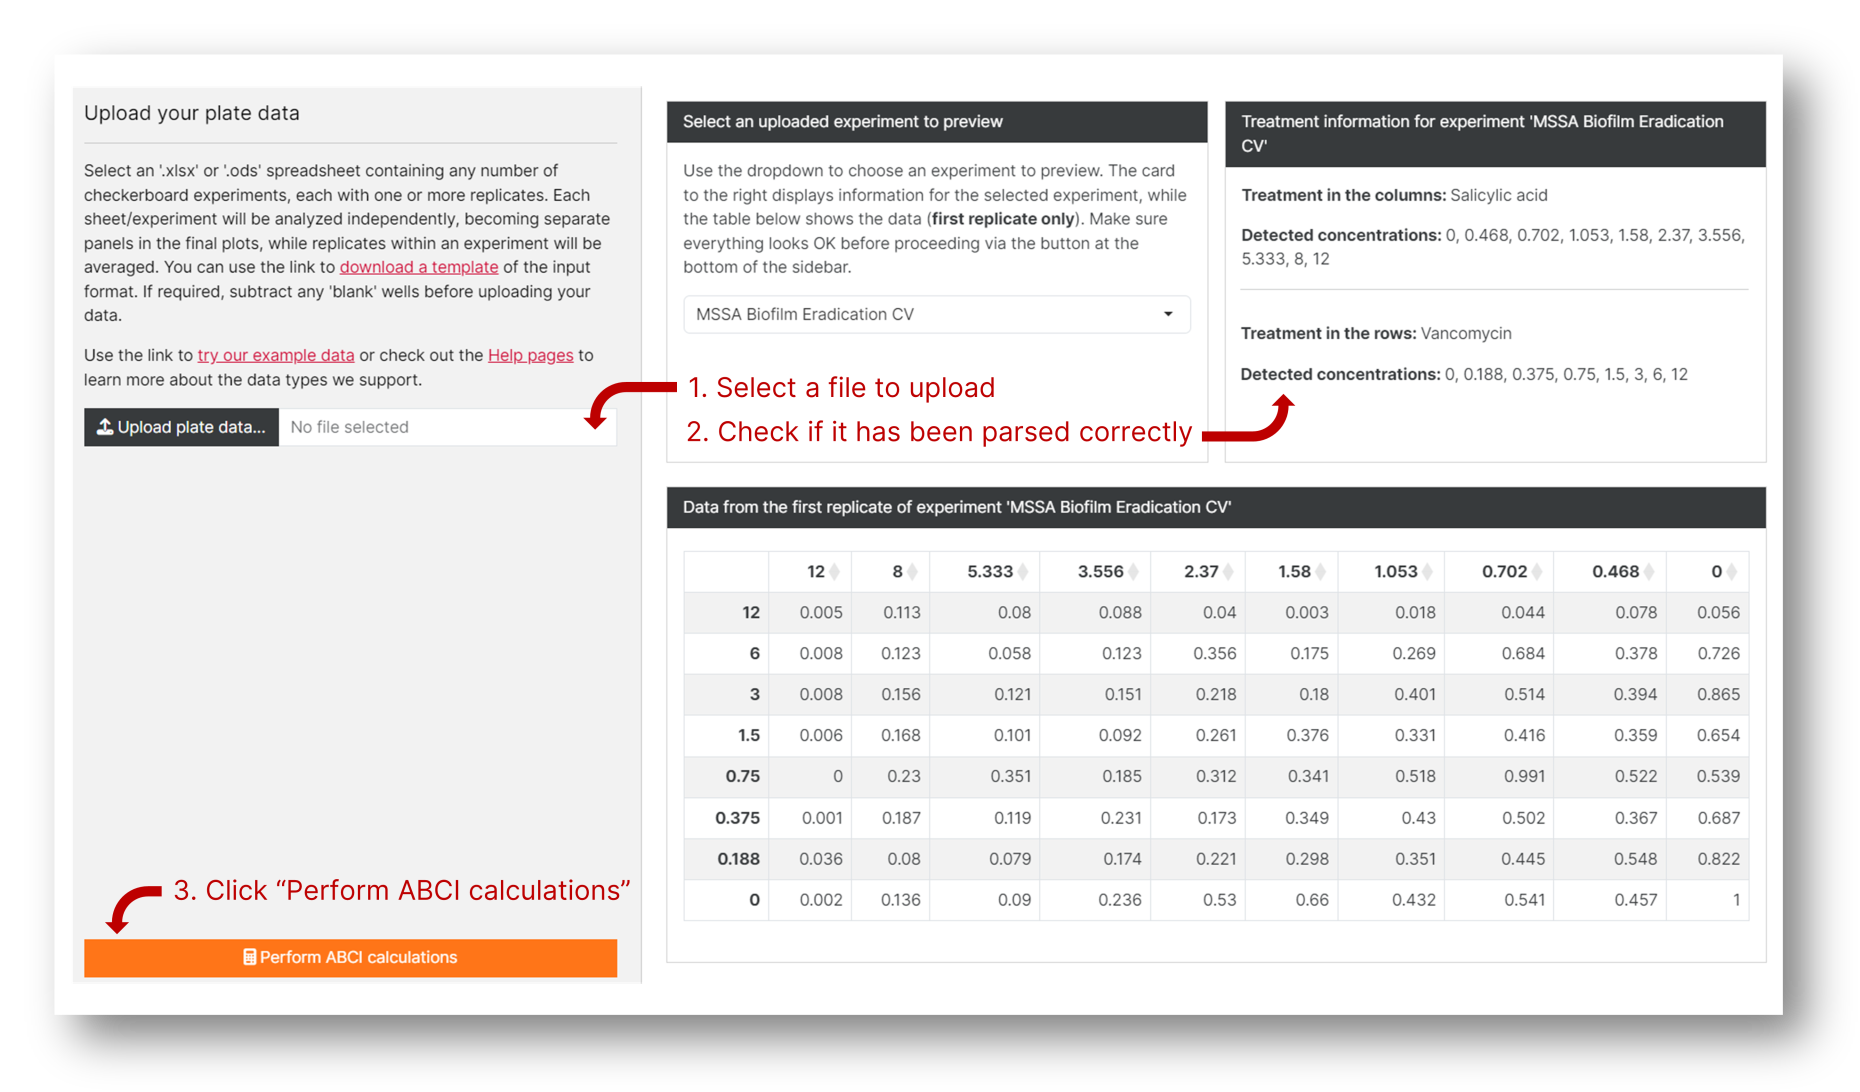
Click "Upload plate data" and select an .xlsx or .ods file formatted as detailed above. An input preview will appear to the right of the screen detailing the treatment in the rows and columns of each of your experiments, as well as the different concentrations included. Make sure everything looks OK and click "Perform ABCI calculations". If the preview does not reflect your intended input, the most likely reason is a mistake in the input file; try downloading the template and copying and pasting your data onto it.
After clicking "Perform ABCI calculations", a dialogue window will appear with two options for data normalization. By default, ABCindex will assume your data is direct observations (e.g., absorbance units or relative fluorescence units) and convert them into percentages relative to the average of the untreated wells (both concentrations equal to zero). This is the "Normalize my data" option. If you have already converted your data to percentages (for example, to make them relative to a growth control consisting of multiple wells per plate), select "My data is already normalized" instead.
Once you have made the appropriate selection, click "Calculate ABCI values", which will perform the analysis and take you to the "Results" tab.
3. Create plots from your results
ABCindex lets you visualize two types of information:
- Drug interaction (Anti-Biofilm Combination Index). Positive values indicate a drug combination that presents higher antimicrobial activity at the given concentrations than any of the individual drugs on their own (additive or synergistic behaviour). Negative values indicate a combination with worse activity than at least the best of the individual drugs (antagonism). See the ABCI calculations tutorial for more information.
- Antimicrobial activity (percentage of biomass killed). Depending on the type of experiment, this may have different biological interpretations, such as biofilm inhibition or biofilm eradication.
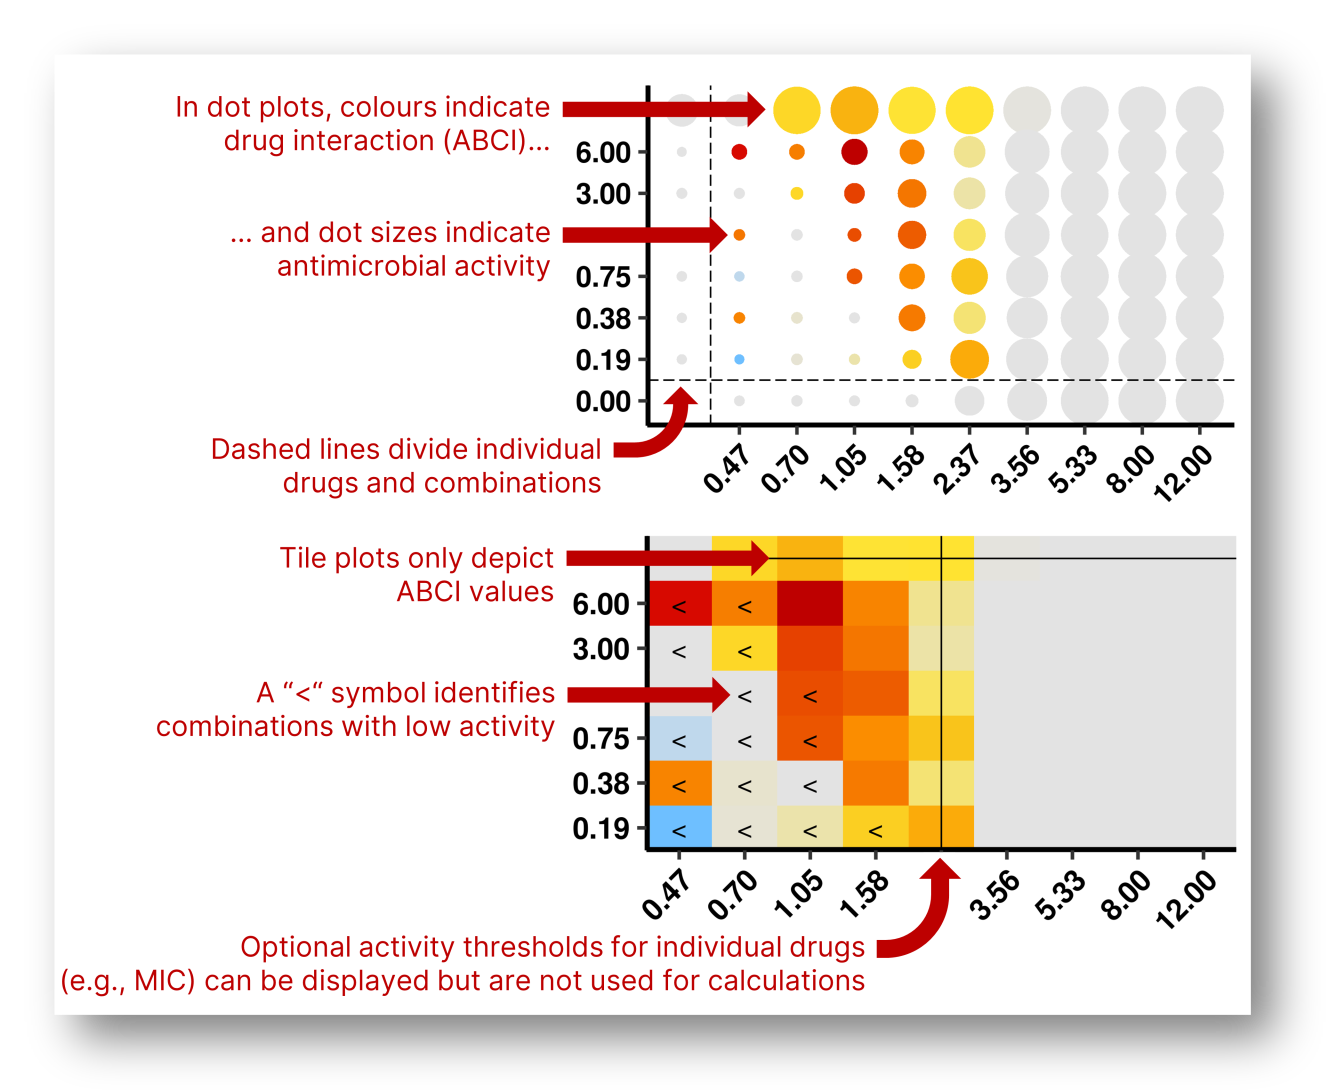
The recommended plot for ABCindex results is the dot plot, which depicts both ABCI values (as colours) and antimicrobial activity (as dot sizes). You can also use tile plots to represent only ABCIs; in that case, we recommend choosing the drug concentrations you are most interested in and representing their antimicrobial activity in a line plot. Dot and tile plots are available in split versions that separate the positive and negative ABCI values into two different plots for visual simplicity.
Choose the type of plot you want and click "Create or update the plot". You can use the options below to modify the plot and click "Create or update the plot" again to confirm the changes. Hover over an inputs' name to see an explanatory tooltip.
At the bottom of the sidebar there are buttons to "Download a results spreadsheet" for your ABCI results (as an XLSX file), or "Download the plot" currently displayed plot as a PNG, SVG, or TIFF image file.
Additional buttons can be used to "Restore defaults",resetting all the plot inputs to their original state, or to "Analyze a new data set". Note that the latter option will cause all results and plots to be lost, so be sure to save anything you want to keep first!
Learn more
ABCindex represents ABCI values using continuous non-linear palettes designed to highlight the most biologically relevant differences. Negative ABCIs are represented with little colour variation, as any drug interaction with less antimicrobial activity than the individual drugs already indicates of antagonistic behaviour.
Default ABCindex palettes (A) provide a colour gradient for positive ABCIs with a contrasting colour for low positives to improve the discoverability of positive interactions that fall short of formal synergy. Accentuate high ABCI palettes (B) move the contrasting colour to ABCI > 1.0 combinations to attract more attention to synergistic behaviour. Positive/negative ABCI palettes (C) remove contrasting colours to depict only whether drug interactions are positive or negative.
We are colourblind friendly. All ABCindex palettes are designed, to the best of our knowledge, to be accessible for people with protanopia, deuteranopia, or tritanopia.

In case you want to focus exclusively on positive or negative drug interactions, we offer "split" tile and dot plots, which separate the positive and negative ABCI values into two different plots.
The "filter stringency" option, available in the advanced options box exclusively for split plots, lets you choose the behaviour of split plots towards indifferent drug interactions (ABCI value close to 0). Choose "loose" to display those values on both plots or "strict" to hide them.
As a visual aid to interpret drug interaction data, you can plot lines indicating thresholds of antimicrobial activity for the individual drugs (e.g., MIC, MBIC, MBEC). To activate this option, check one or both of the boxes for "Draw activity threshold". The target killing percentage can be modified in the advanced options box; the default value is 0.5 (50% killing, e.g. MIC50).
Antimicrobial activity thresholds are provided exclusively as visual indicators and are not used for calculations. When enabling them, a warning may appear describing an issue with the activity threshold calculation. This can indicate one of a few things:
- For one or more replicates, no tested concentrations reached the specified threshold.
- There was disagreement among replicates about the theshold concentration. In the case of two replicates disagreeing, the lower concentration is used. For three or more, a single mode is utiliized.
- The activity threhold could not be determined, either because no concentrations reached the specified value, or there was no agreement between any replicates (e.g. each of three replicates returned a different result).
Any of these scenarios will result in the same warning, which will name the problematic experiment(s).
Line plots are simple representations of the antimicrobial activity of your drug combinations. Given the number of concentrations often evaluated in checkerboard assays, full line plots of all your data may be hard to read. We recommend first using ABCI plots to identify the most relevant concentrations and represent only those in the line plot.
By default, ABCindex's line plots gently nudge some values along the X axis to prevent overlapping lines. This can be disabled by toggling off the "X axis jitter" in the advanced options box.
ABCI calculations
Information about the Anti-Biofilm Combination Index and how ABCindex calculates and plots the data.
Rationale behind ABCindex
ABCindex aims to overcome the main challenges presented when evaluating antibiofilm combination therapies and, in more general terms, provide a way to quantify the impact of combining antimicrobials, focused on therapeutic decisions rather than mechanistic concerns. While the analysis methodology and scoring system ABCindex uses can be applied to any kind of multidose drug combination assay, the Anti-Biofilm Combination Index (ABCI) is principally designed to deal with biofilm inhibition and biofilm eradication experiments.
In checkerboard assays, the impact of drug combinations is traditionally described using fractional inhibitory concentrations (FIC). FICs are determined by calculating the minimum inhibitory concentration (MIC) for individual drugs and their combinations at a given killing threshold and then determining the relative change in MIC the combinations represent. An overall 4-fold reduction or higher results in an FIC of 0.5 or lower, and is described as “synergy”. A 4-fold increase results in an FIC of 4.0 or higher and is described as “antagonism”.
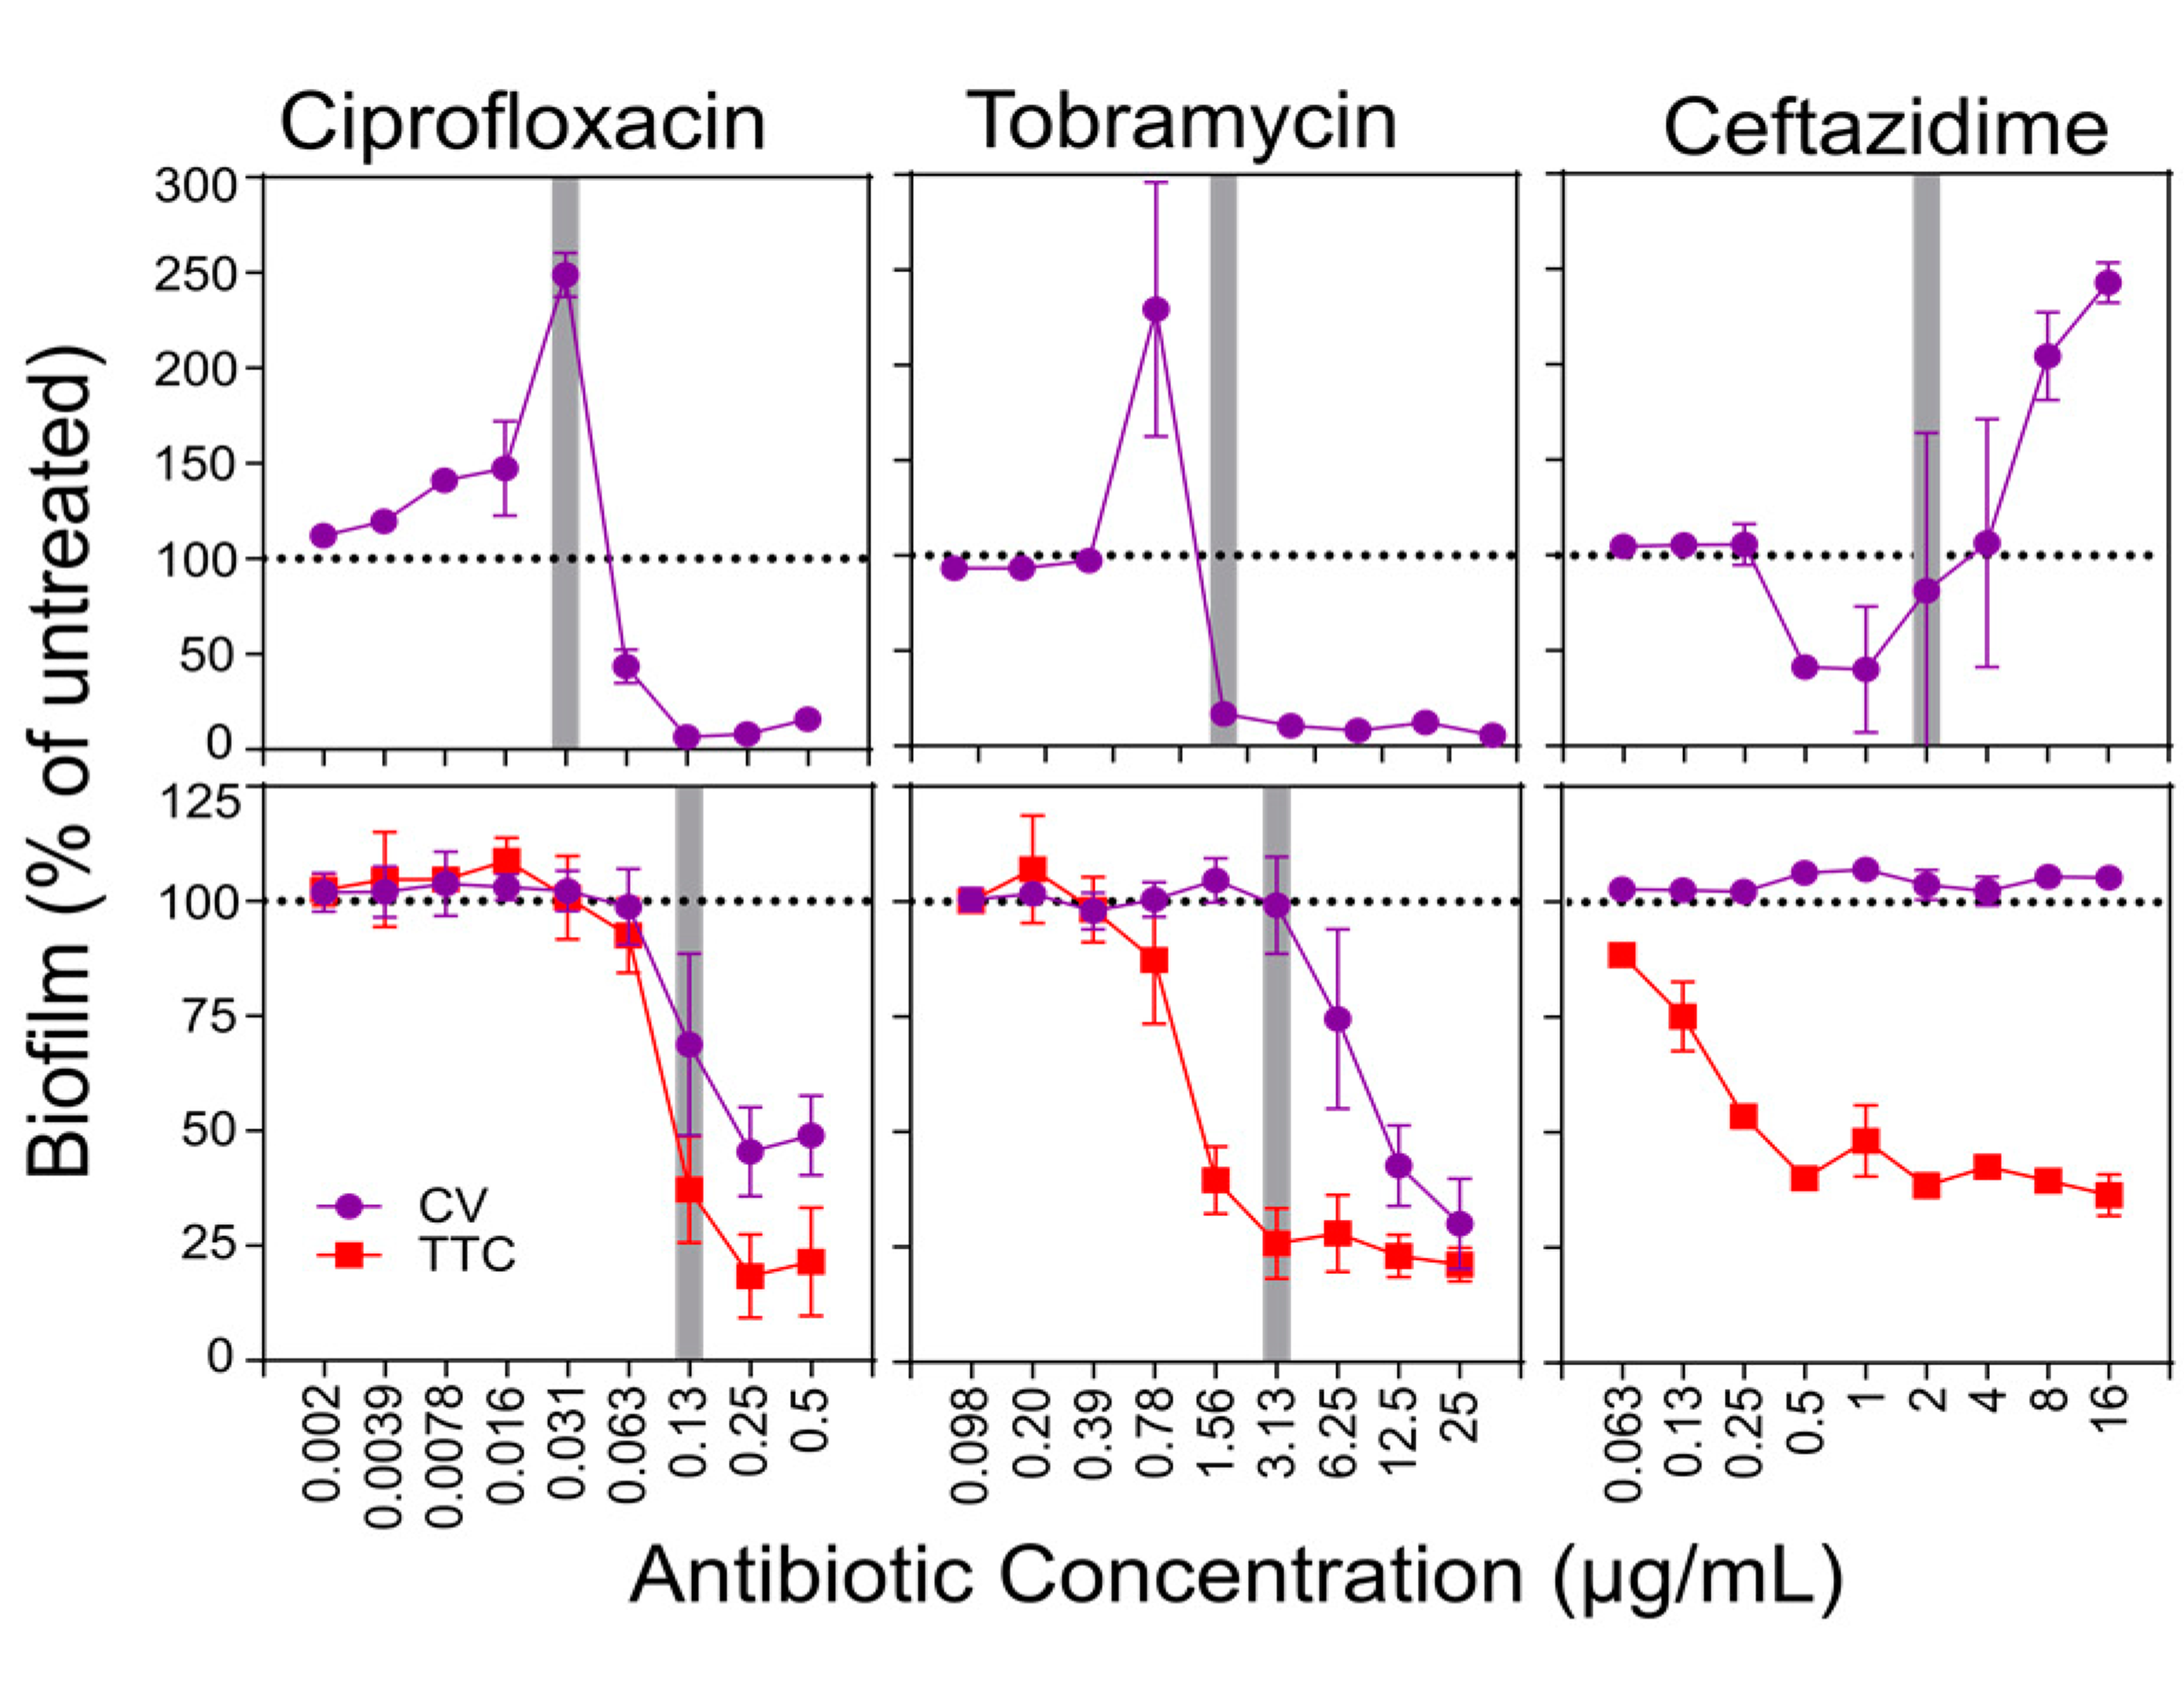
While FICs have been successfully used for half a century to summarize the effects of combining traditional antibiotics, any metric that relies on activity thresholds becomes inaccurate when the dose-response curve of the drugs studied differs significantly from the typical growth/no growth curve observed when killing planktonic cells with traditional antibiotics. Antibiofilm drugs often present unusual dose-response curves, featuring gradual biofilm reduction across a wide range of concentrations, incomplete biofilm elimination even at the highest dose assayed, and subinhibitory biofilm stimulation peaks. As an example, the experiment below (Haney et al., https://doi.org/10.3390/biom8020029) illustrates these phenomena in the dose-response curves of commonly used antibiotics against Pseudomonas aeruginosa PAO1 in both biofilm inhibition (top) and biofilm eradication assays (bottom).
ABCI is a simple metric designed to accurately describe the effects of drug combinations even when they present unusual dose-response curves. Additionally, ABCI values are intended to accurately represent the most fundamental decision behind combination therapies: how much can be gained by combining two drugs compared to using the best individual drug on its own. Finally, as checkerboard assays produce results that depend on two variables, resulting in hard-to-visualize information that is often published as lengthy tables or 3D graphs, the ABCindex app not only calculates ABCI values but also summarizes all of the information obtained in simple and visually appealing graphs designed to quickly identify promising interactions and favourable drug ratios.
Anti-Biofilm Combination Index
The Anti-Biofilm Combination Index (ABCI) is calculated for each specific combination of drug concentrations (i.e., each well on a 96-well plate). It is designed to assess drug combination therapy without relying on antimicrobial activity thresholds (e.g., MIC), focusing on the most important difference when making therapy decisions: is the drug combination better than using the best individual drug on its own?
ABCI is defined as the difference between the percentage of biomass killed by the drug combination and the percentage killed by the best of the individual drugs, divided by the combined effects of the two individual drugs. It can be calculated as follows:
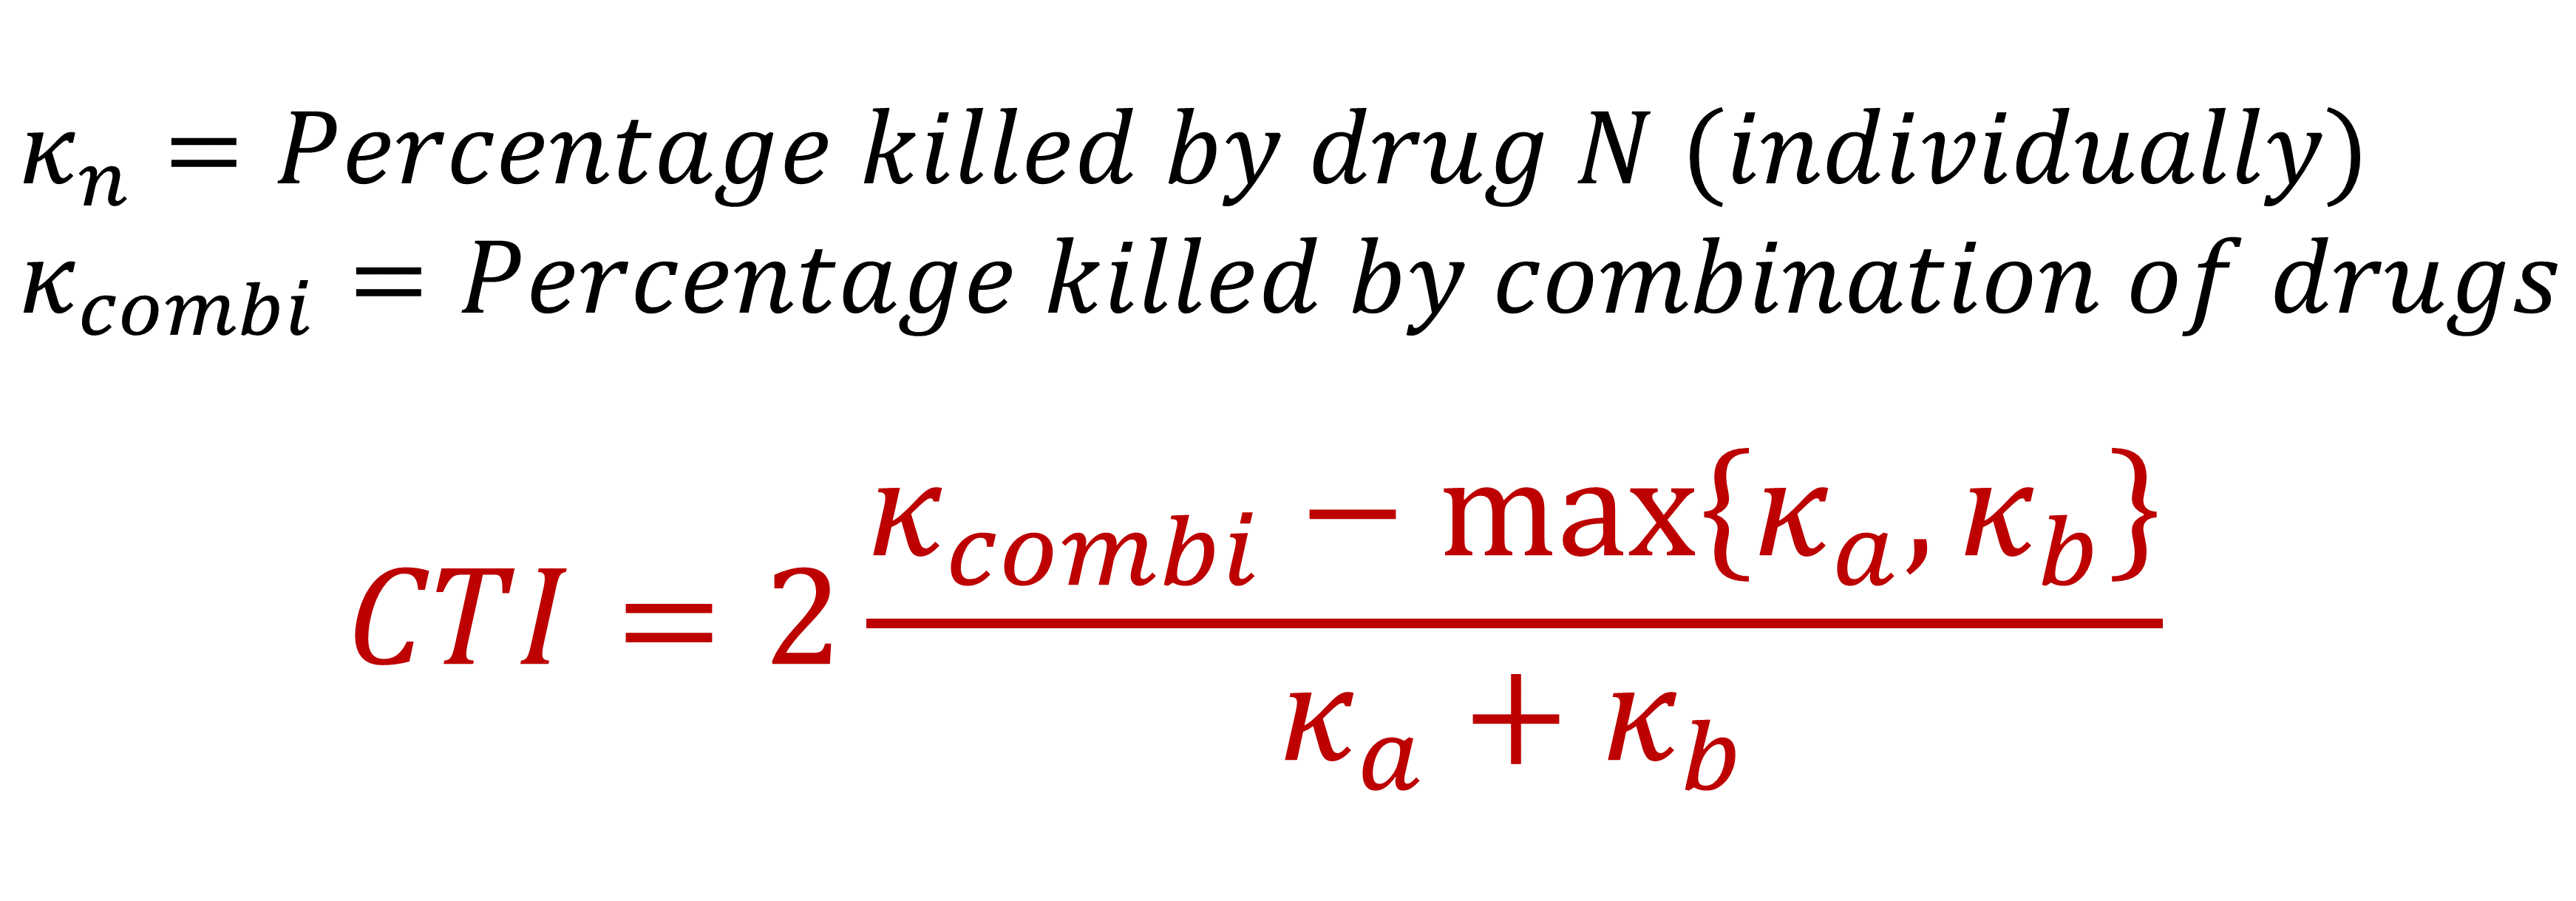
The resulting ABCI value can then be interpreted as follows:
- A positive ABCI indicates that the drug combination presents higher activity than any of the individual drugs (additive or synergistic behaviour). Higher ABCI values indicate a more significant gain in antimicrobial activity relative to the combined effects of the individual drugs.
- An ABCI of zero indicates that the drug combination presents the same activity as at least the best of the individual drugs (indifferent behaviour).
- A negative ABCI indicates that the drug combination presents lower activity than at least the best of the individual drugs (antagonistic behaviour). Lower ABCI values indicate a more significant loss in antimicrobial activity relative to the combined effects of the individual drugs.
The following table illustrates possible ABCI values and their interpretation depending on the combined effects of two drugs A and B:
| Killing for Drug A | Killing for Drug B | Combined Killing | Interaction Type | ABCI Value |
|---|---|---|---|---|
| 30% | 30% | 100% | Synergistic | 2.33 |
| 40% | 40% | 80% | Perfectly additive | 1.00 |
| 50% | 50% | 90% | Imperfectly additive | 0.80 |
| 70% | 70% | 70% | Indifferent | 0.00 |
| 20% | 90% | 80% | Antagonistic | -0.18 |
| 70% | 70% | 50% | Antagonistic | -0.29 |
Data processing in ABCindex
Checkerboard data uploaded to ABCindex goes through the following steps:
- If the data is being normalized, calculate the baseline value, where the concentration of both drugs is 0, and divide every other value by that number. Then for each well, calculate the effect by subtracting it from 1. Negative values are set always to 0.
- If normalization is not specified, calculate the effect by subtracting each well from the previously defined baseline value, again not allowing for negative results.
- Then, find the "reference" value for each drug concentration, defined as the average effect when the other drug is at 0.
- All the above information is then entered into the ABCI formula to calculate a result.
The effect (i.e. percentage of biomass reduction) and ABCI values are averaged across replicates; this is what's shown in the plots, and downloaded in the results spreadsheets.
Learn more
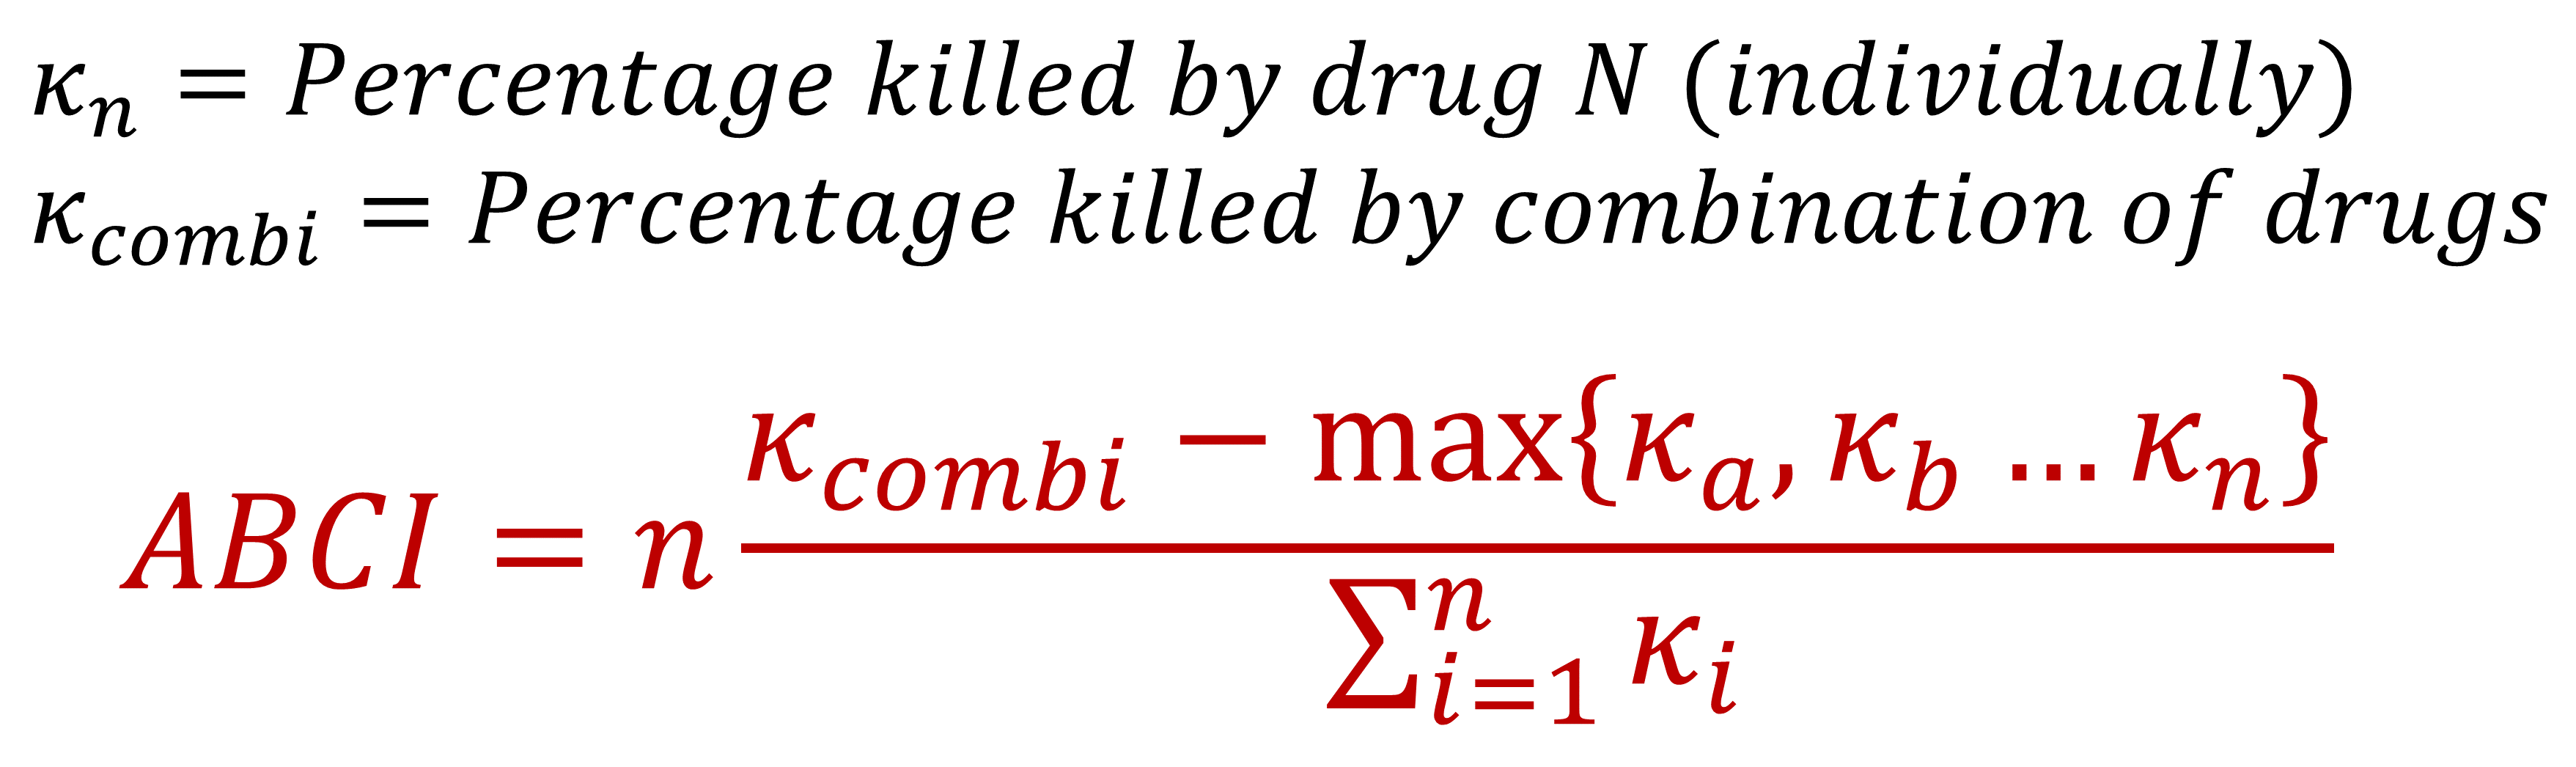
While ShinyABCi is designed to analyze checkerboard data and thus can only support combinations of two treatments, the Anti-Biofilm Combination Index can be generalized to the combination of n drugs as follows:
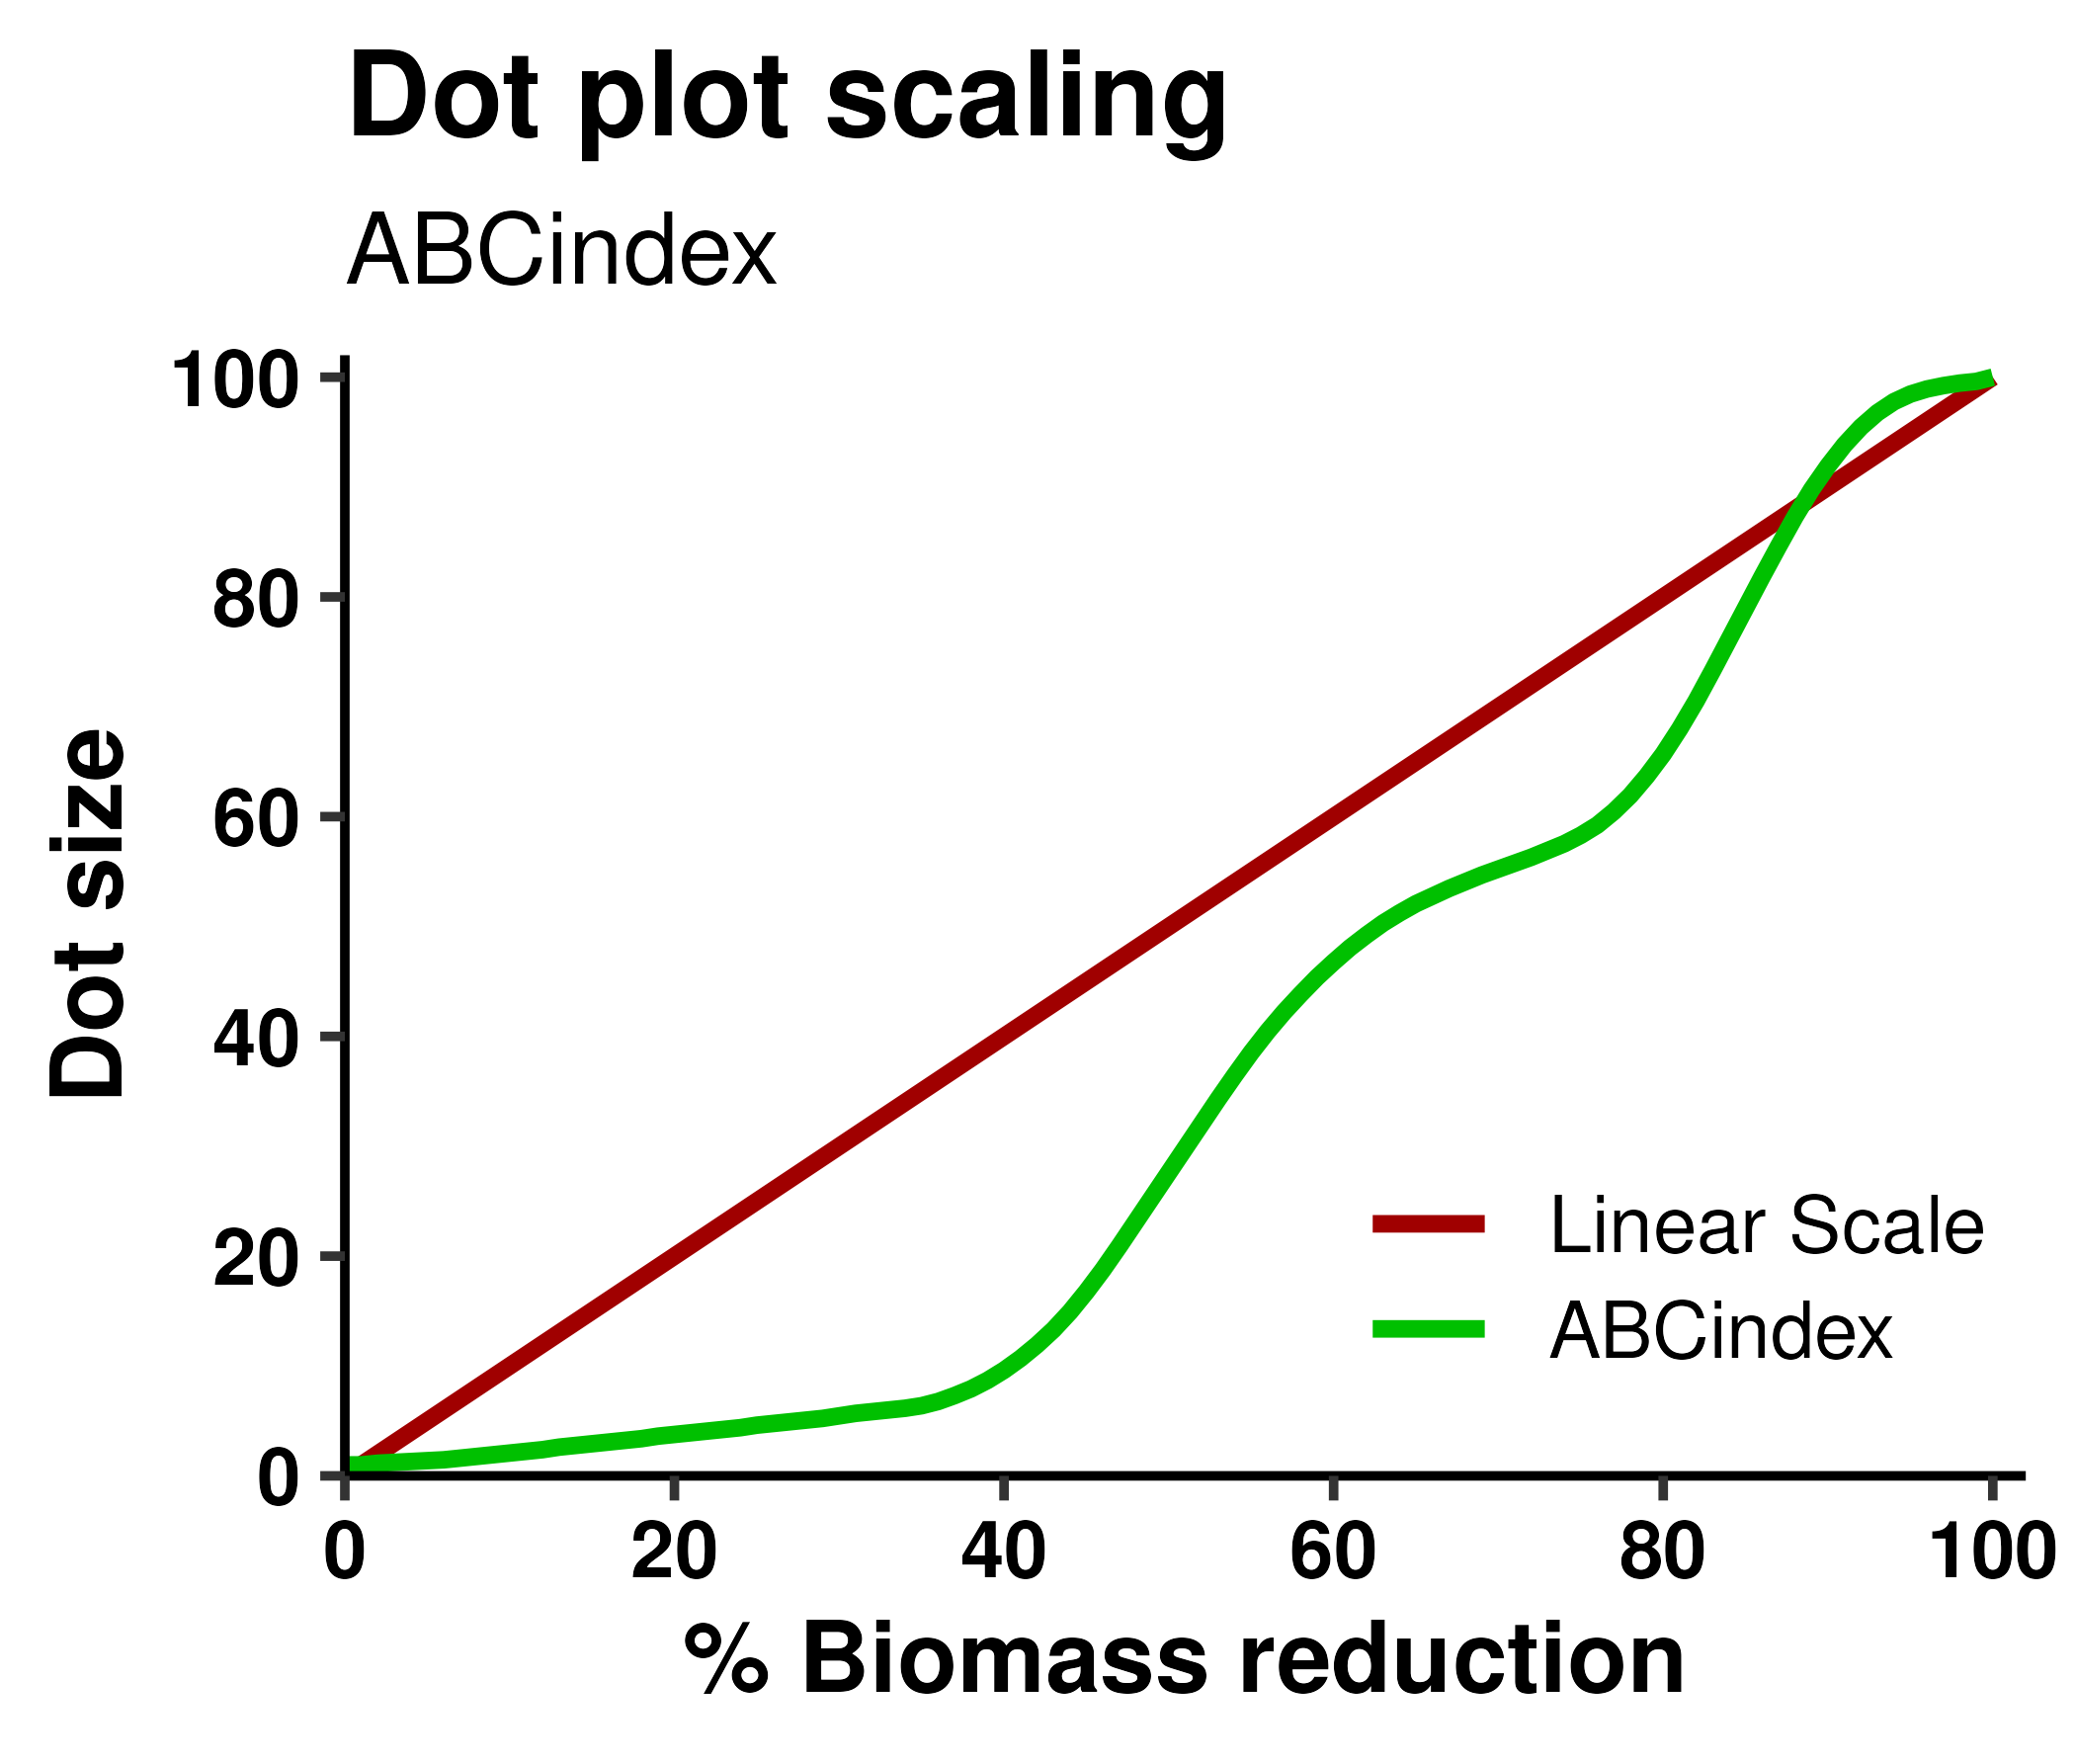
By default, ABCindex's dot plots represent antimicrobial activity (percentage of biomass killed) using a continuous non-linear scale designed to highlight the most biologically relevant differences. More specifically, while preserving some degree of granularity all across the scale, our plots are designed to maximize the size difference between ±50% killing (often considered the threshold between "active" and "inactive") and the difference between ±85% killing. We consider that last difference to be of the utmost importance, given that ABCindex is primarily intended for antibiofilm assays, in which complete eradication is often hard to achieve and one of the main reasons to attempt combination therapies. Non-linear scaling can be disabled by toggling "Linear size scaling" in the advanced plot options.
Below, you can see the exact relationship between the percentage of biomass killed and the default dot size used by ABCindex.
About
ABCindex is an R Shiny app that facilitates the calculation of the Anti-Biofilm Combination Index (ABCI). The metric was created by Lucas Pedraz, and the app was developed by Travis Blimkie, all at the REW Hancock Laboratory at the University of British Columbia.
Help pages
Information on the usage of the app and calculation and interpretation of ABCI values can be found here.
Reporting problems
If you encounter any bugs or other issues, please submit an issue at our Github page.
Dependencies
ABCindex is written with R, and uses the following packages:
- shinycssloaders
- Add loading animations to Shiny outputs
- shinyjs
- Extend Shiny functionality with Javascript
- tidyverse
- Packages for data manipulation and visualization